Check services regularly
Scheduled checks monitor production applications and stable beta deployments. Concurrent probes and timeouts keep one slow service from holding up the whole check.

Keeping a website useful includes knowing when something needs attention. Whimsy’s Warden monitors application availability and response times, bringing service checks and incident alerts into one operational view.
Open Warden ↗The project
Running websites and applications means looking after them after launch. A service can be reachable but unusually slow, or stop responding altogether. Whimsy’s Warden brings those conditions into one monitoring system for production applications and stable beta deployments.
The project combines concurrent service probes, scheduled checks, stored incident state, a responsive dashboard, and email notifications. Its job is to make the current operational picture easy to read and to call attention to a new problem without sending the same message over and over.
What we built
Scheduled checks monitor production applications and stable beta deployments. Concurrent probes and timeouts keep one slow service from holding up the whole check.
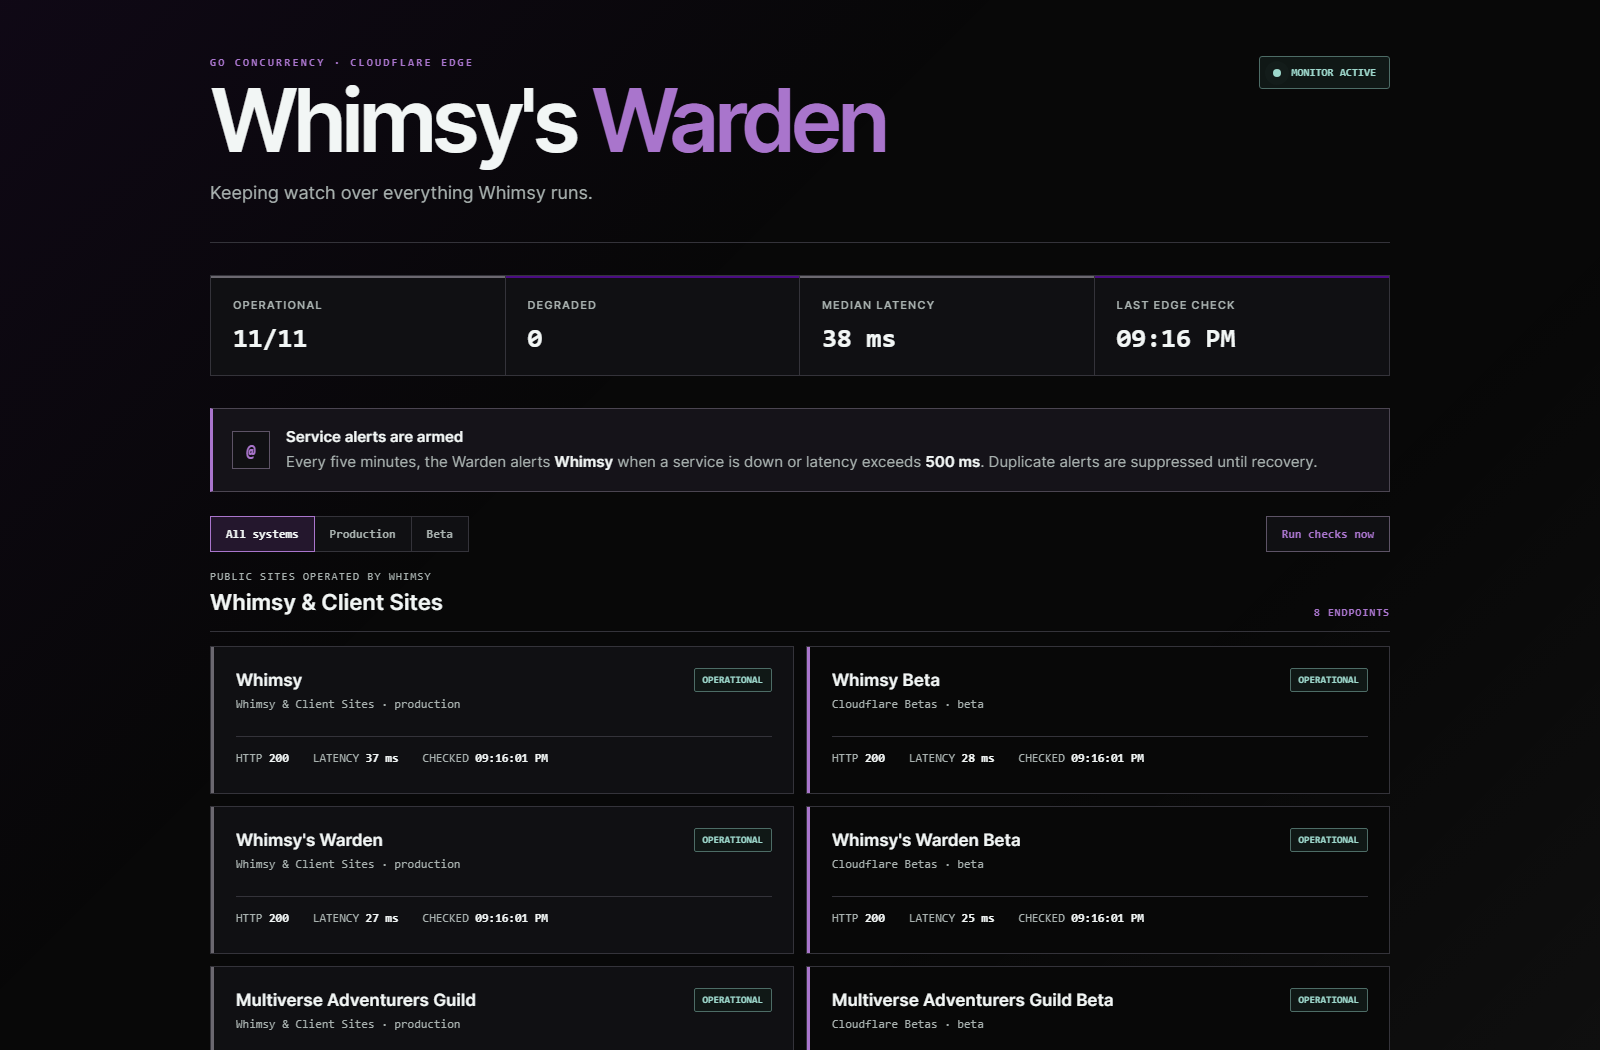
A responsive dashboard brings together service health, response times, and the latest check. Environment filters help narrow the view.
Email alerts report new outages and slow responses. Stored incident state suppresses repeated notifications while the same problem continues.
Monitoring engine
The Go monitoring engine checks targets through a bounded pool of workers. Multiple requests can run together, while the concurrency limit keeps the process controlled. Explicit timeouts and cancellation prevent a service that is slow or unresponsive from keeping the entire check open indefinitely.
Connection reuse, redirect limits, and deliberate TLS settings keep the HTTP client predictable. A shared target inventory describes the applications being checked, and results return in a consistent order even when individual requests finish at different times. That makes the same information easier to use in command-line output, tests, and the dashboard.
From check to notification
Scheduled edge checks evaluate availability and response latency, then save the latest snapshot and incident information. The dashboard reads that operational state, while notification decisions compare what just happened with what the system already knows.
Keeping a snapshot and incident state serves two different purposes. The snapshot explains the latest check to someone viewing the dashboard. The incident state helps the system decide whether a problem is new, continuing, or has recovered before another alert is needed.
A scheduled Cloudflare Worker starts checks every five minutes and gathers availability and latency results for the configured targets.
Cloudflare KV stores the latest snapshot and incident state so the dashboard and alerting decisions share the same evidence.
Email reports new outages and responses above the configured 500 ms threshold. A continuing incident does not trigger duplicate alerts at every check.
Operational interface
The dashboard summarizes healthy and degraded services, median latency, and the time of the latest check. Individual service cards provide the detail behind that summary. Production and beta filters narrow the view, and a manual refresh can request another check when someone needs current evidence.
The layout adapts across desktop, tablet, and mobile screens so the same information can be reviewed at a workstation or on the go. The interface is dependency-free, keeping the dashboard focused on a small set of operational tasks rather than requiring a larger application framework just to report service health.
Production and beta
Production and beta deploy independently. The beta environment has its own storage namespace and does not run the production alerting schedule. That separation allows changes to be checked without creating a second stream of notifications for the same real-world issue.
The dashboard shows the latest available status instead of an outdated saved copy, while activity logs help the team investigate problems. Together, those choices make Warden an example of the less visible work behind a useful digital service: checking it, reporting its condition clearly, and supporting it beyond the initial launch.
Software by John Bieniek. Read the engineering overview ↗
Let’s build something useful for your audience and your community.
Start a conversation →